Today I’m going to introduce a project that is one of many formulations of functional assessment we’ve been developing. The current formulation was first put to use more than a year ago with Benji Schoendorff, MSc and the Contextual Psychology Institute (CPI).
Below, you’ll see a data visualization built around “The Matrix” framework. The Matrix framework was developed some years ago by Kevin Polk, Benji Schoendorff, and others. It has gained quite a bit of popularity as a way to teach Acceptance and Commitment Therapy skills to both clinicians and clients. Use of The Matrix framework typically involves having clients or clinicians identify thoughts, feelings, and experiences and how they are oriented on the visual cross-hatch above. This is meant to help people begin to orient to important relationships between their behaviors and their experiences, without necessarily teaching the more elaborate hexaflex model of Acceptance and Commitment Therapy processes. In practice, most clinicians do not teach the skills taught in Acceptance and Commitment Therapy (ACT) by actually teaching the hexaflex to clients, but clinicians frequently start by learning this more complex model and trying to then translate that into how they work with clients. This is sometimes difficult for clinicians and can sometimes result in rather “canned” applications of ACT when clinicians are first mastering the model. Thus, the Matrix model is about teaching fluidity of process and flexibility in a way that often translates more easily.
This brings us to the Matrix Visualization that we’ll discuss today. What you are seeing, is best conceptualized as a tool to assist in the functional assessment of verbal behavior in the context of other behaviors you may observe from the client that are less difficult to track. We have used Ecological Momentary Assessment (EMA) and behavioral observations of other types to better situate verbal behavior (vocal or written) in the context of a functional analysis.
The picture below is only one of many formats to make looking at many layers of verbal behaving and actual behavior of individuals in a way that can help us see the meaning of ongoing behavior, in context. The visualization below is simply an output (like a graph) that is the result of using Natural Language Processing (methods of using computer science to examine verbal behavior) to process written or speech behavior. These measurements and the content tagged in the written behavior are then fed into a real-time data visualization (using Tableau) to allow us to see a visual model of what is reflected in the written or vocal verbal behavior over a particular period of time.
In this post, I will simply show the visualization and the source and describe what you are seeing. To be sure, visualizing behavior through The Matrix format – is a matter of preference. Just as one can look at data in a bar graph or a pie chart, so too can we change the output format in which we display the ever-changing patterns of verbal behavior seen across time and context.
This visualization below is an example run on a piece of my own writing from an earlier post entitled, “RFT the Space-time of the Human Universe.” Here you will see a single moment of time of my own experience and verbal behavior reflected in the Matrix Visualization format. Though we have used this formulation in organizations that data is confidential. We’d also like to note that this work has evolved through a partnership with Contextual Psychology Institute (CPI). We greatly appreciate their continuing support of the development of this work.
The Matrix Viz
A tool to assist in functional assessment of verbal behaving within the larger context of a client’s behavior. This visualization is a data-driven analysis of verbal behavior only, again this would typically be used with other data about the client’s behavior across contexts to assist the clinician in functional analysis.
Though what the eye is frequently drawn to is the “content” level displayed, what should be attended to more fully is the movement of the content and changes in it over time. This snapshot gives us a brief idea of what of the likely functions of behavior across the time point covered by this writing, it should not in any way be considered a stable assessment of behavior (the writing period consisted of a few hours at most). To gain a better understanding of the function of behavior longer periods of communication should be analyzed and changes in the visualization noted. Further, change in quantitative form is useful to examine – but the visualization itself is meant to bridge some of the gaps encountered by clinicians and trainers as they attempt to use assessment to understand the ever-changing experience of their clients.
The assessment tool is driven by examining ideographic relating patterns, and to a lesser extent, the nomothetic functions of verbal behavior. This measurement is ideographic in the sense that it reflects patterns of relating specific to the individual, over the time covered. It is not based on the assumption of a normal curve of frequency or average levels of communication about a particular topic.
This measurement is nomothetic in the sense that at some level language has a shared cultural conditioning history, this is essential for it to function as a “language.” That is, if we don’t share enough of the same conditioning/relating history with regard to any word, sound, or group of words – then effective communication across individuals does not happen. Therefore, there is a level at which “content” based analysis does become relevant. For example, the concept of the verbal “self” (i.e., deictic relating) is based on the idea that the process of the verbal world speaking about us, identifying our experience, and of learning to speak about our experience ourselves – is fairly universal. The content that then becomes conditioned around the experience of the “self” is then identifiable by examining the language that ideographically hangs together around the content of “I”, “me”, etc. This is further supported by a significant body of research from others in related fields, such as Pennebaker who have extensively examined the function of pronouns using Natural Language Processing methods.
Further, though “universal” aspects of our language learning experience can be examined tagged to content, as mentioned above, most of the rest of the levels of analysis shown here is driven by vector-based Natural Language Processing methods. These do not assume particular content but instead look at changes in language by dropping to the level of semantic, syntactic, or statistical examination of the probability of a word/statement, etc following another word. Thus, rather than assuming normality around the frequency of a spoken word in a particular human context – they depend more on the underlying structure of language. This allows us to assume less about the content we expect and to pay more attention to the changing “signal” reflected in an individual or group’s “languaging” behavior. We can then use changes in the “signal” to understand what interpersonal, environmental, and other factors – constitute important contextual influences on the individual’s behavior.
At any moment, we relate on many levels of our experience. The “what” of what we relate is the layer most commonly assessed by psychological measures – it is by nature highly biased. “What,” we say is highly rule-governed and influenced heavily by contextual factors. It is well appreciated that our ability and willingness to report our experience moment-to-moment leads to significant response bias. Further, the methodology of asking about a specific “what” leads to efforts to standardize and statistically remove the influence of the questions themselves and other context. This is where the concept of standard error, etc. come into the creation of assessments. Assessing using a methodology that does not assume so many levels of normality, allows us to drop down to a lower level of analysis – a lower level of construct – and thus, hopefully, move closer to examining actual behavior and change – functionally.
This is akin to looking more at the “how” of verbal relating, an indicator of experience. This is, in a way, similar to the difference between asking someone how much they hurt and instead of having them rate “0 (None) to 10 (A Lot),” listening to their expression about their pain from the warble in their voice or the strength of the words they use to describe their pain.
The Matrix Viz
An example of the Matrix visualization as tool for assisting in the functional assessment of verbal behaving.

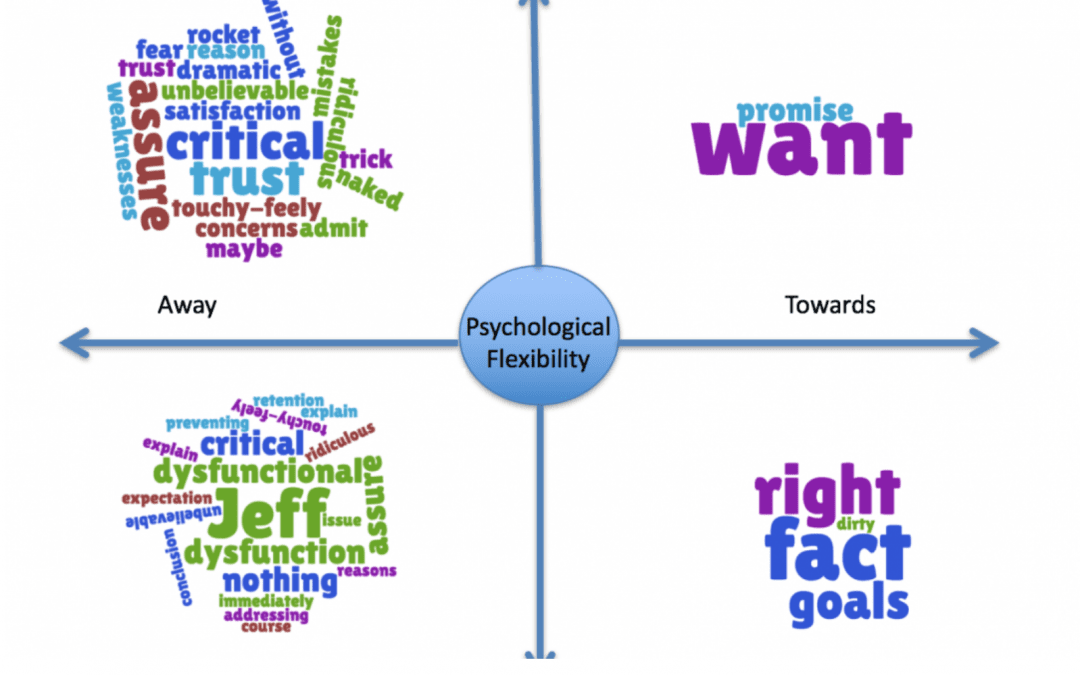
What can we see from this visualization?
Notice that the content is not sorted simply by base level “content”. There are phrases that on a face level of “content” would likely appear to belong in another quadrant. This categorization of content is based more heavily on the surrounding context in which the content appears. This occurs through a “weighting” of semantic and syntactic writing features that “weight” the “how” of the context of that the content is used in over the outright content-based meaning of the word. In other words, the “latent” levels of relating show you the deeper levels of experience relative to the surface “content” levels. This means that “I” or other pronouns may show up in any quadrant of the visualization based on the deeper relating context that which “I” is used. It is not simply “I” that falls in the lower right quadrant. It is based on the individual’s use and experience that shows up repeatedly around that content. Similarly, the same “content” can be reflected in different colors and quadrants simultaneously and this reflects our continuously changing relations and/or relating at different levels to the same content during a specific time point. For example, if the individual experienced a level of conflict between a desire and its aversive consequences, this same content might show up in red and green and in different quadrants. For example, desiring alcohol but feeling that one should not engage in drinking – would lead the word “alcohol” or any word in the same semantic group used to mean it to show up in red and green, in quadrants reflecting this simultaneous difference in the “function” of alcohol for the person.
The words in this particular visualization are coded in red, green, and black. These are micro indicators akin to red = aversive, green = appetitive, and black = neutral. So, for example – you can see that in this visualization “personal experience” comes up as both “red” = and aversive, and yet, it is in the “Toward” half of The Matrix. This reflects that in the author’s experience at the time of this writing – the personal experience was likely aversive but yet being approached.
In the bottom right quadrant, you see indications of values – again, you must step around surface content to see that “dancing” is a semantic substitute for a value of “playfulness.” A clinician or consultant using the Matrix Visualization to guide assessment would not assume the meaning of “dancing.” They should use the visualization as a guide and query the particular meaning of the content with the individual. This is akin to what you might do in a clinical session, pick out the patterns in relating and try to understand their significance in both the individual’s life and their behavior. The clinician can then use this information to understand and quickly assess likely functions and to use that to guide questioning and to also use more clinically and personally relevant metaphors for use in treatment.
In the bottom left quadrant, “Thinking/Away” – the main noticeable characteristic is the volume of material that shows up, both aversive and appetitive material. Notably, the content is also highly intellectualized and a bit defused sounding. This reflects the author’s tendency to intellectualize.
In the top left quadrant, “Sensing/Away,” you see indications of experiences that fall in networks of relations that were being moved away from at this point in time. Again, this type of assessment is best used as a method for examining likely functional relationships, following up with questioning with the client, and further using the assessment over time to examine likely changes in functional relationships. Thus, this kind of assessment likely provides a great deal more clinical useful information to a clinician than the average measure of “symptoms” – that reflects little about the client’s interpretation of those symptoms, no information about how the symptoms functionally relate and relies on self-report survey methodology that by nature includes a high degree of response bias influence.
If you’re curious about Natural Language Processing as up and coming method of quantitative assessment in Contextual Behavioral Science – See our Resources menu.

Angela Coreil, PhD
Consultant and Educator
Angela J. Coreil, PhD works with individuals and organizations to promote better connected, purposeful, and effective living through behavior analytic principles. She has over a decade of clinical experience treating human suffering and promoting human excellence using Acceptance and Commitment Therapy (ACT) and other behavioral therapies. She now focuses on the promotion and translation of Clinical Behavior Analysis as a way to improve our science.


Comments